
1.3 Million HYROX Results: Pacing, Progress, and the Podium
1.3 million official HYROX results, made interactive: from the field to target splits, the five-minute gap, four pace types, station and format strategy, and the truth about podiums; seven findings come last.
- How big is HYROX? — 111 events and ~1.2M participations a season; 40%+ race again within a year (§1)
- How fast for my target? — 60/70/80 min ≈ 3:57/4:32/5:09 per km; PRO 5–16s faster, Doubles 20–45s slower (§2)
- Five minutes faster — train what? Running 41% + the core four 36%; the ergs (Ski/Row) just 4.8%; RoxZone 10% (§3)
- Which type am I? Four self-checkable types; just not fading beats 27% of the field (§4)
- Format conversion? Open→PRO +6.8/+4.9 min (M/F); Doubles hinges on the partner gap; Relay ~−16 min (§5)
- A podium strategy? No — podiums are faster everywhere plus clean process (§6)
- Where do I stand for my age? The same 90 minutes is top 61% at 25–29 but top 27% at 60–64 (§1)
01 Eight seasons: more races, bigger fields, and returning athletes
This study is built on officially published HYROX race results, accumulated over several weeks of synchronization that respected the official site's rate limits throughout (throttled requests, halting on any access anomaly). A read-only snapshot was frozen on 2026-07-23: 1,305,177 raw result rows (with an archived SHA-256 checksum — a tamper-evident digital fingerprint proving the data hasn't changed since); after removing 59,354 structurally duplicated or invalid rows (4.55%) under mutually exclusive rules, 1,245,823 rows enter the analysis. Quality audit: 554 first-page results across eight official events were compared row by row — 548 exact matches (98.9%); the Season-8 official event catalog is covered 111/112. The full cleaning ledger is in Appendix 1; this page publishes aggregates only, never individual results.
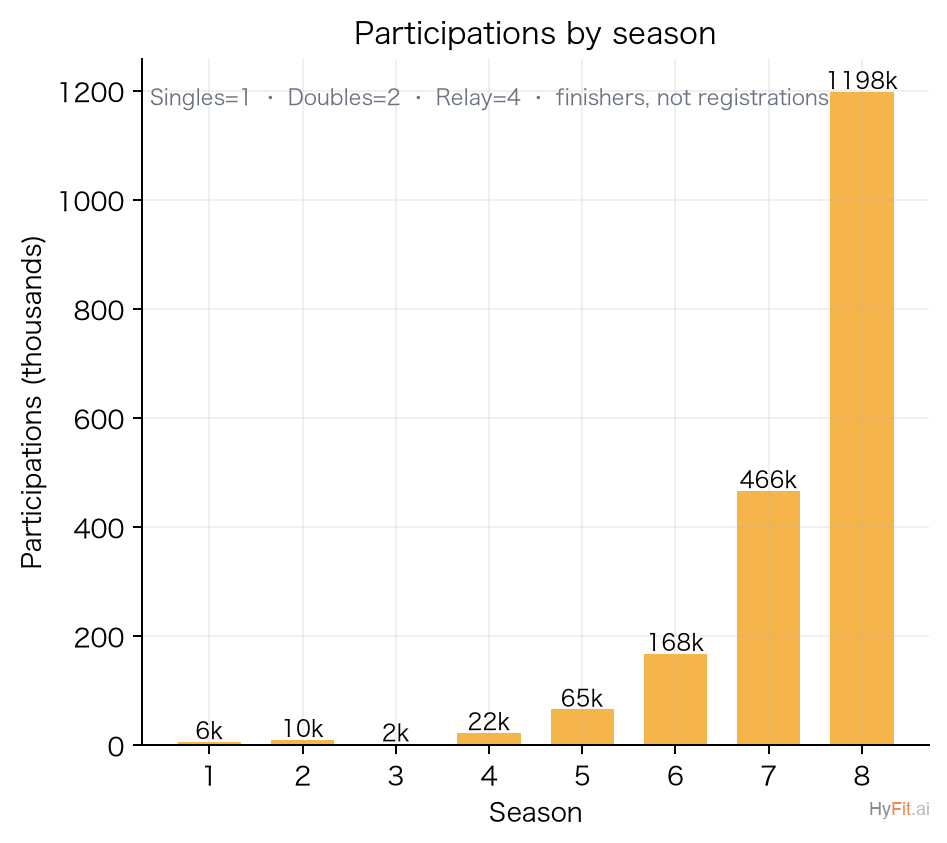
| Season | Events | Result rows | Participations | Unique athletes* | Starts/event |
|---|---|---|---|---|---|
| S1 (2019) | 9 | 4,745 | 5,809 | — | 645 |
| S2 (2020) | 11 | 7,267 | 9,693 | 4,285* | 881 |
| S3 (2021) † | 4 | 1,429 | 1,670 | 446* | 418 |
| S4 (2022) | 24 | 15,831 | 22,271 | — | 928 |
| S5 (2023) | 39 | 44,529 | 65,234 | — | 1,673 |
| S6 (2024) | 55 | 109,988 | 167,612 | 46,602* | 3,047 |
| S7 (2025) | 72 | 296,300 | 466,016 | 111,795* | 6,472 |
| S8 (2026) | 111 | 740,380 | 1,197,971 | 242,081* | 10,793 |
Notes: participations count Singles=1, Doubles=2, Relay=4 (finishers, not registrations). * Unique athletes are matched approximately by name+nationality+sex (Open/PRO Singles only), so small errors are possible; early seasons with incomplete identity data show "—". † Season 3 (2020–21) was COVID-disrupted: only four US events — a structural break, excluded from YoY.
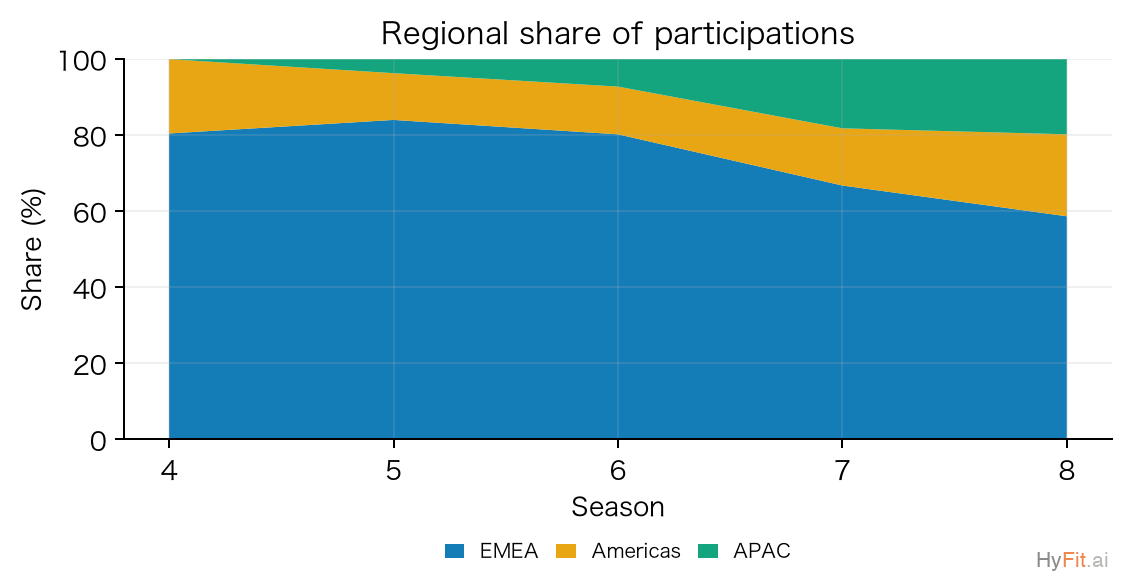
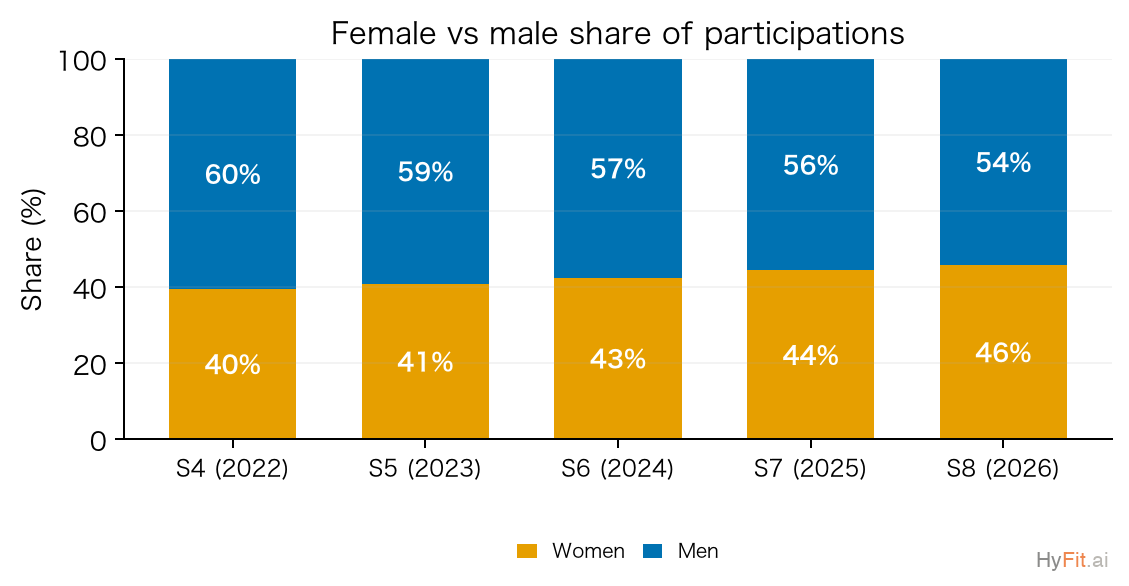
The table in one sentence: HYROX is on a steep growth curve — participations grew ~54× from S4 to S8 (roughly 1.7× per year), still expanding at +157% in the latest season. Two engines fire at once: more races (24→111 events) and bigger races (928→10,793 participations per event), see Fig. 1. The structure is being rewritten too: EMEA still holds ~60%, but APAC has surged from 3.7% to ~20%, the fastest-expanding region (Fig. 2); the female share rose from 39.6% to 45.9%, near balance (Fig. 3) — HYROX is turning from a Europe-centric, male-majority event into a global, gender-balanced mass sport.
Age: who races, and how fast each age needs to be to podium
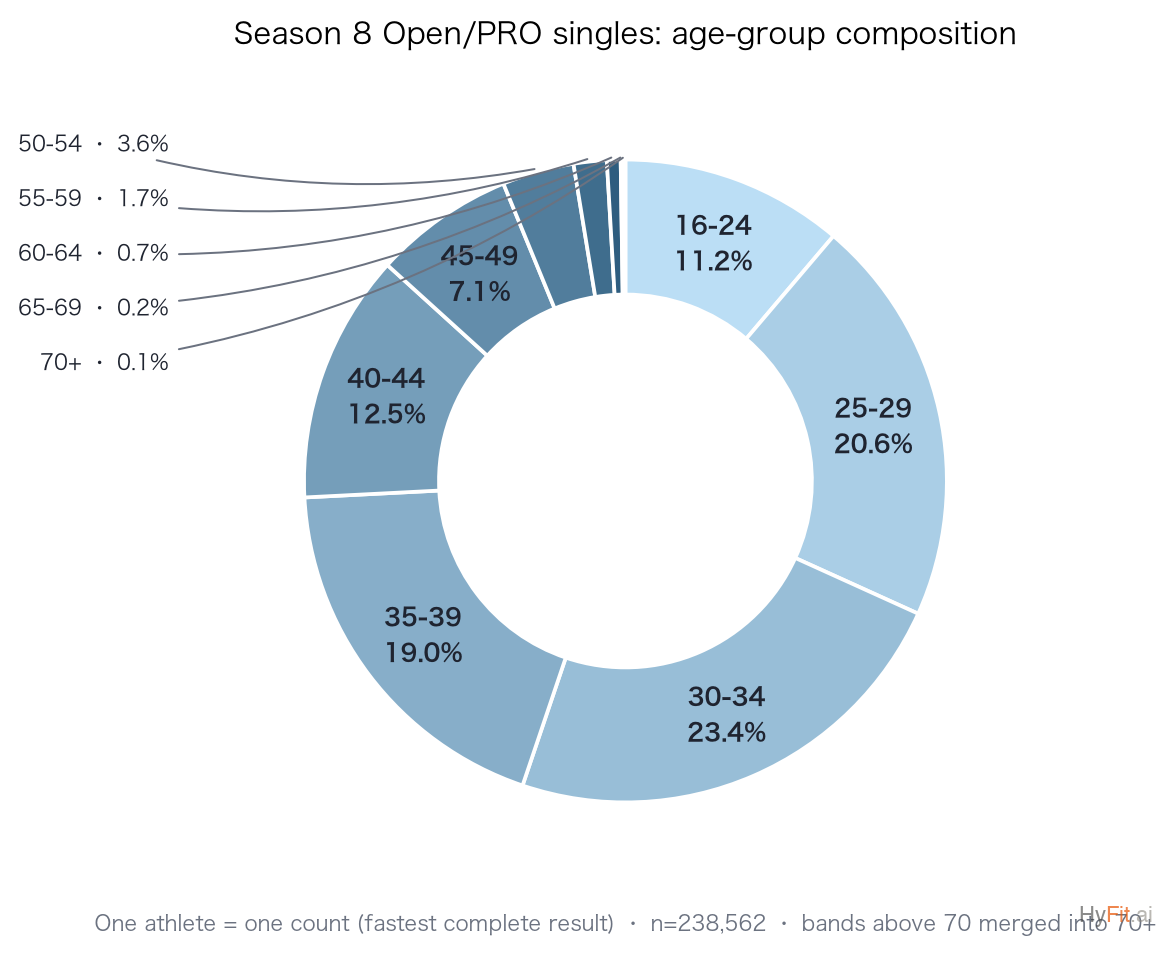
- Composition: ages 25–44 carry the field (~three quarters) — 30–34 largest (23.4%), then 25–29 (20.6%) and 35–39 (19.0%); over-55s are under 4%.
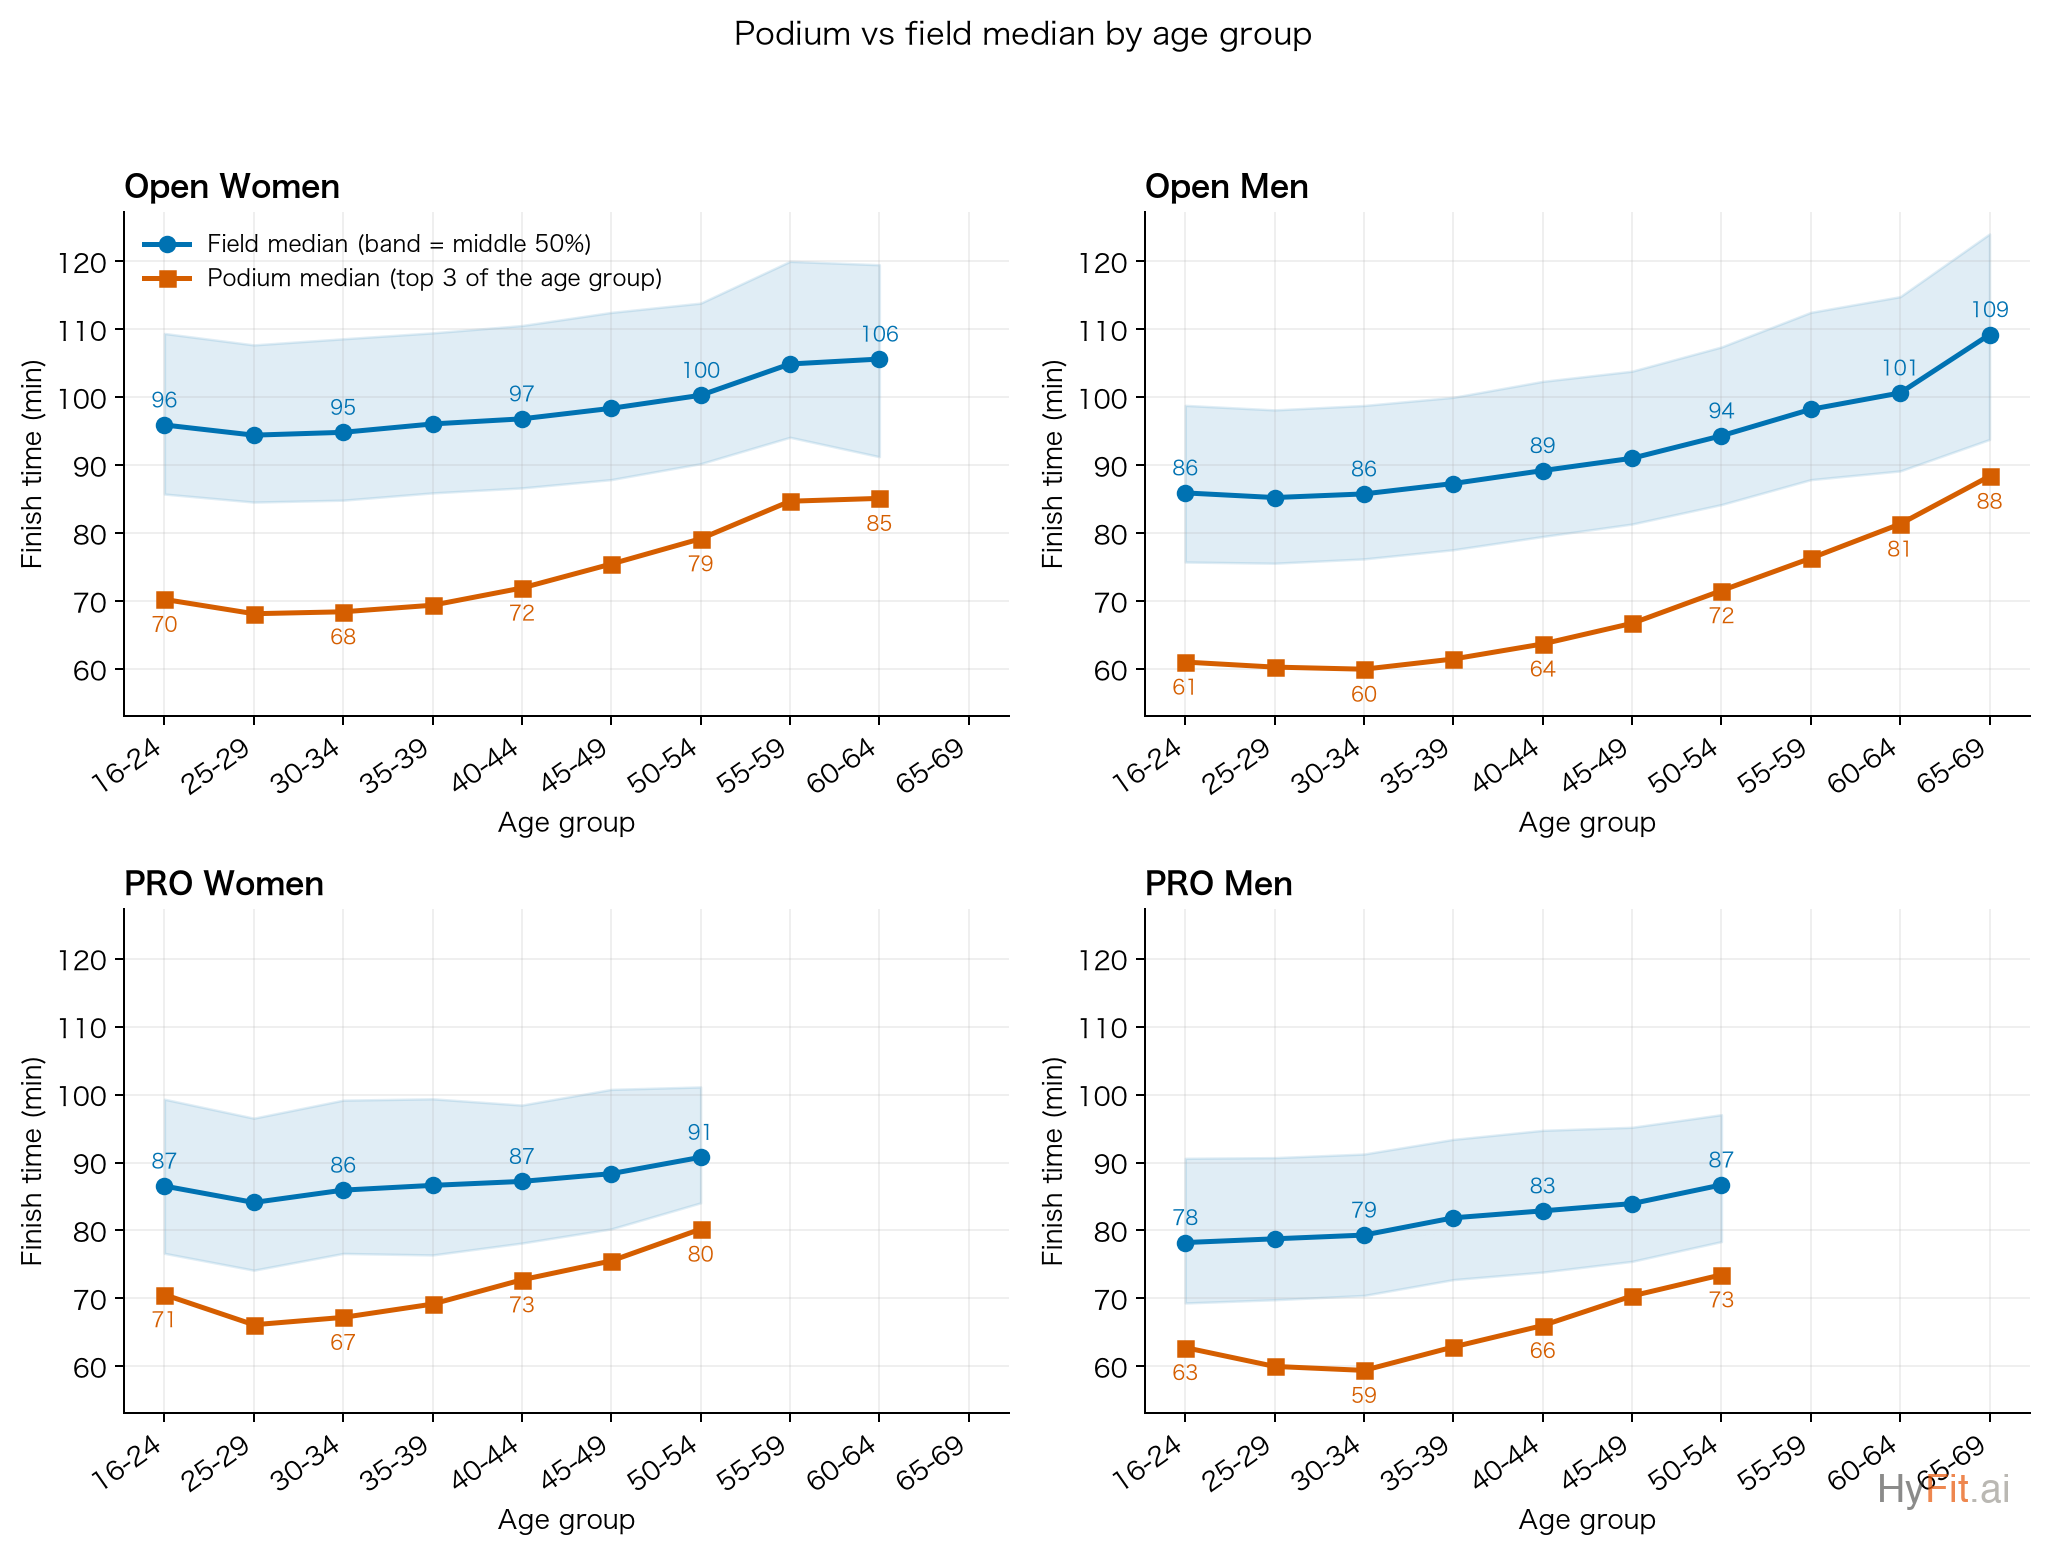
- Podium line vs field median: podium finishes run ~20–27 minutes faster than the age-group median — ~26–27 min in the prime bands (Open men 30–34: podium 60.0 vs median 85.8) narrowing to ~20 min after 55. PRO field medians beat Open by 7–9 min at matched ages, yet the podium lines are similar — Open's far bigger fields run deep at the top.
- The podium bar rises every year: same-city, same-age-group third-place cutoffs got a median 1:57 faster S7→S8 — ~1.5 min in Open, ~3 min in the more contested PRO. Staying on the podium means getting ~2 minutes faster per year.
Podium = top 3 of each event × division × sex × age-group cell with ≥10 finishers; the Fig. 5 band is the middle 50% of finishers.
Retention: do athletes race again within 3 / 6 / 12 months?
Starting at each athlete’s first Open/PRO Singles race in a season, we ask whether they race again and how often returners race. Identity and date conventions: see footnote2.
Retention: probability of racing again within 3 / 6 / 12 months
| Season | 3 mo | 6 mo | 12 mo |
|---|---|---|---|
| S6 | 7.4% | 22.1% | 40.7% |
| S7 | 10.4% | 22.6% | 41.7% |
| S8 | 13.3% | 30.8% | 43.6%1 |
Returner stickiness: mean later starts among returners
| Season | 3 mo | 6 mo | 12 mo |
|---|---|---|---|
| S6 | 1.11× | 1.23× | 1.61× |
| S7 | 1.13× | 1.30× | 1.69× |
| S8 | 1.16× | 1.42× | 1.80×1 |
In-season frequency is rising too: Open/PRO singles athletes average 1.28 (S6) → 1.30 (S7) → 1.35 (S8) races per season, with the share racing twice or more up from 19.9% to 22.8% — repeat racing keeps growing.
02 Target finish → running pace and station budget
Quick reference: effective pace by target finish
Effective pace = (eight runs + RoxZone) / 8.7 km — an empirical approximation of course length; there is no official uniform distance. Relay rows are team results (four athletes taking turns) — don't benchmark your personal pace against them.
| Cohort | 60 min | 70 min | 80 min | 90 min |
|---|---|---|---|---|
| Open women | —* | 4:37/km | 5:15/km | 5:55/km |
| Open men | 3:57/km | 4:32/km | 5:09/km | 5:46/km |
| PRO women | 3:56/km | 4:26/km | 5:00/km | 5:35/km |
| PRO men | 3:52/km | 4:20/km | 4:53/km | 5:27/km |
| Doubles (all) | 4:17/km | 5:05/km | 5:54/km | 6:41/km |
| PRO Doubles (all) | 4:08/km | 4:54/km | 5:41/km | 6:27/km |
| Relay (all) | 3:59/km | 4:36/km | 5:13/km | 5:50/km |
* Insufficient sample (n<100).
Pace calculator Interactive
▼ Pick a cohort and a target — the table updates live from real finishers at that target.
| 组成项 | 偏快(前25%) | 基准(中位数) | 偏慢(后25%) |
|---|---|---|---|
| Running(8 跑合计) | 34:41 | 36:20 | 37:50 |
| RoxZone(官方计时) | 5:09 | 5:49 | 6:45 |
| SkiErg | 4:15 | 4:23 | 4:32 |
| Sled Push | 2:26 | 2:44 | 3:04 |
| Sled Pull | 3:51 | 4:11 | 4:35 |
| Burpee Broad Jump | 4:05 | 4:31 | 5:00 |
| Row | 4:29 | 4:36 | 4:45 |
| Farmers Carry | 1:43 | 1:54 | 2:06 |
| Sandbag Lunges | 4:05 | 4:27 | 4:49 |
| Wall Balls | 5:10 | 5:45 | 6:26 |
Want every finish band 55–100 at once? The full station heatmap (with cohort selector) is in §4.3.
03 Where does a five-minute gap come from?
We split finishers into five-minute bands and compare each band with the next (T+5 vs T), decomposing the mean difference across Running, RoxZone and the eight stations — where do 75-minute athletes save their five minutes over 80-minute athletes?
Five-minute gap decomposition
| 组成项 | 少花时间 | 差距份额 |
|---|---|---|
| Running(8 跑合计) | 2:10 | 44.2% |
| Wall Balls | 0:35 | 12.0% |
| RoxZone(官方计时) | 0:32 | 11.0% |
| Burpee Broad Jump | 0:26 | 9.0% |
| Sandbag Lunges | 0:22 | 7.5% |
| Sled Pull | 0:19 | 6.6% |
| Sled Push | 0:09 | 3.0% |
| Farmers Carry | 0:08 | 2.6% |
| Row | 0:07 | 2.4% |
| SkiErg | 0:05 | 1.7% |
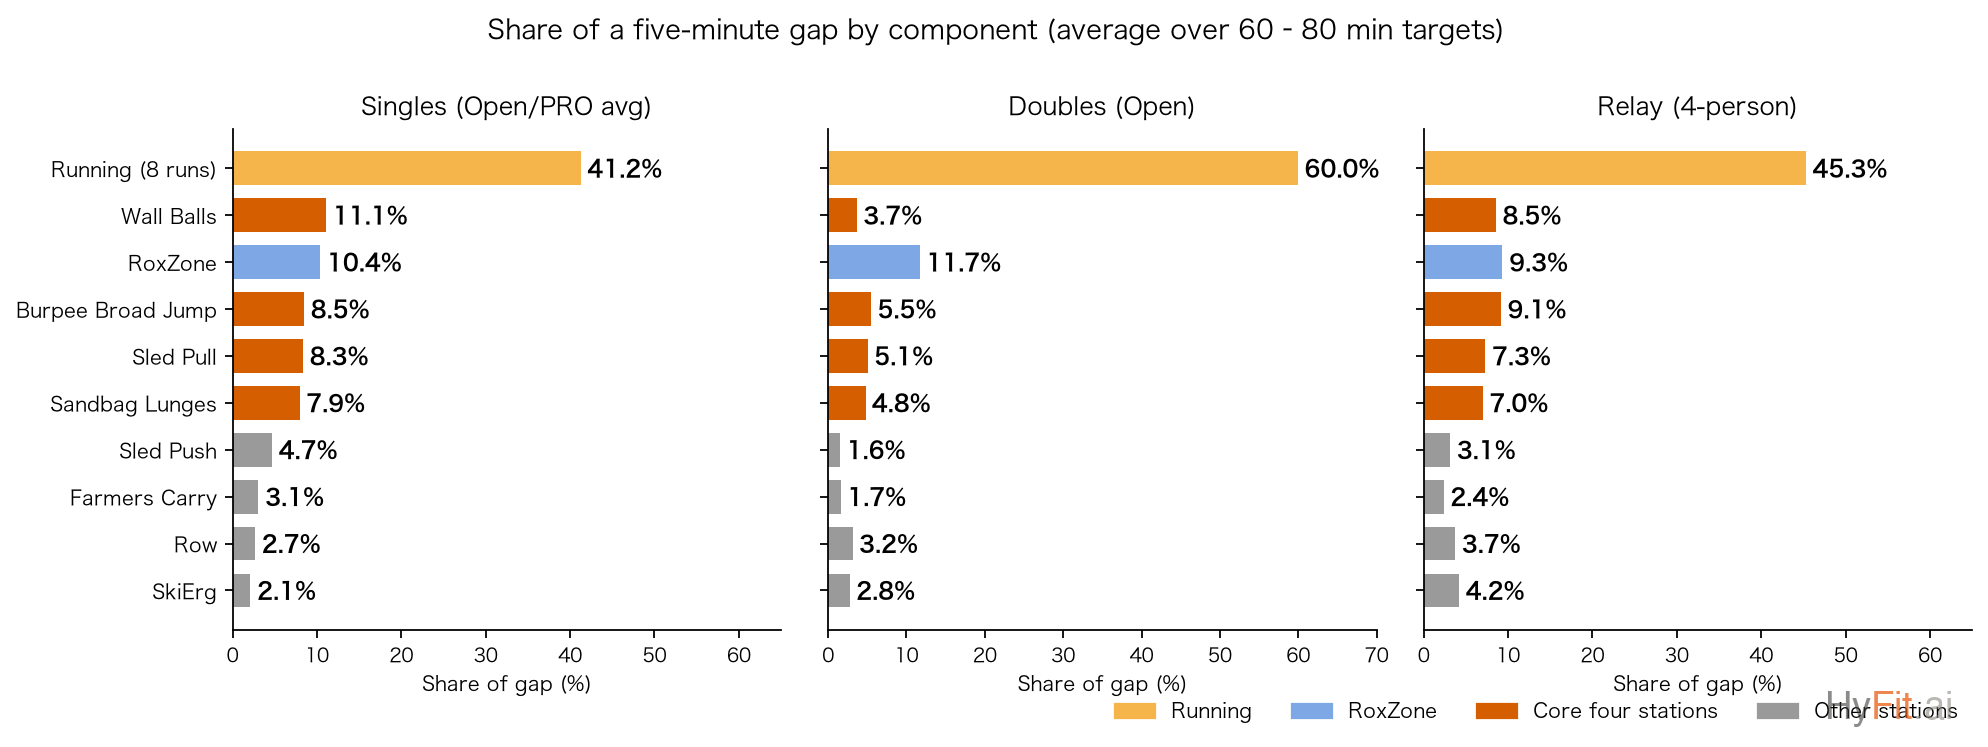
Run the same five-minute decomposition across the three formats and the difference is visible at a glance — singles have five components above 5%, doubles collapse to running plus RoxZone, and relay returns to a singles-like structure:
04 Pacing: your type, the front-runners, and where gaps open
4.1Which pace type are you?
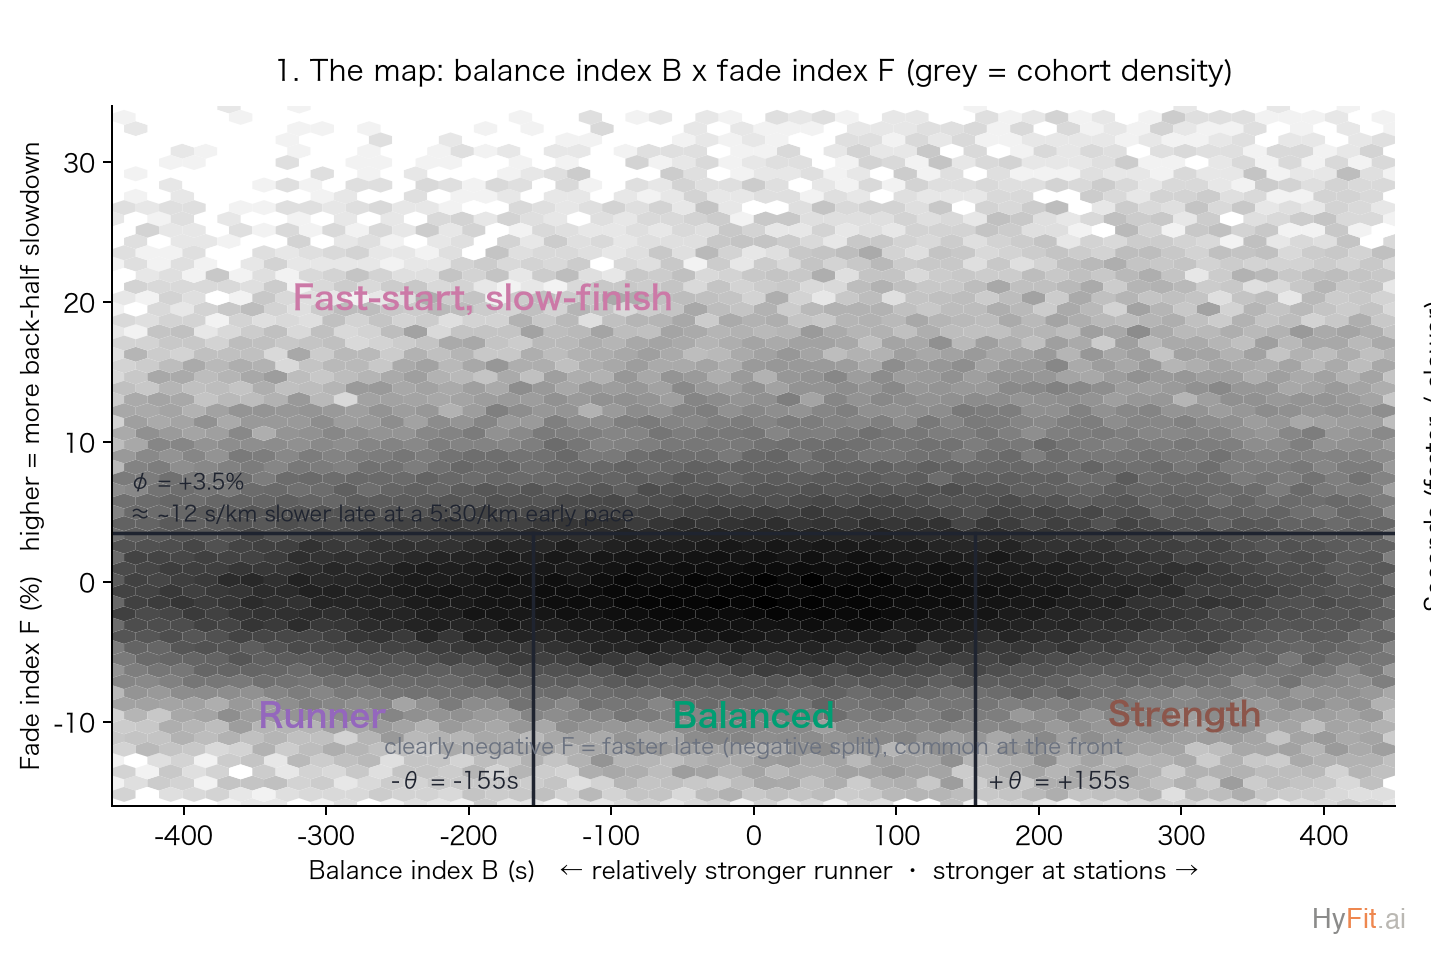
B = (your running total − same-finish running median) − (your 8-station total − same-finish station median)F = (avg runs 6–8 ÷ avg runs 2–4 − 1) × 100%Order: F > 3.5% → fast-start slow-finish; else B ≤ −155s → runner; B ≥ +155s → strength; else balanced. Same-finish medians come from the §2 calculator.
| Type | Share | Signature (vs same-finish peers) | Median finish | Reach top 5% |
|---|---|---|---|---|
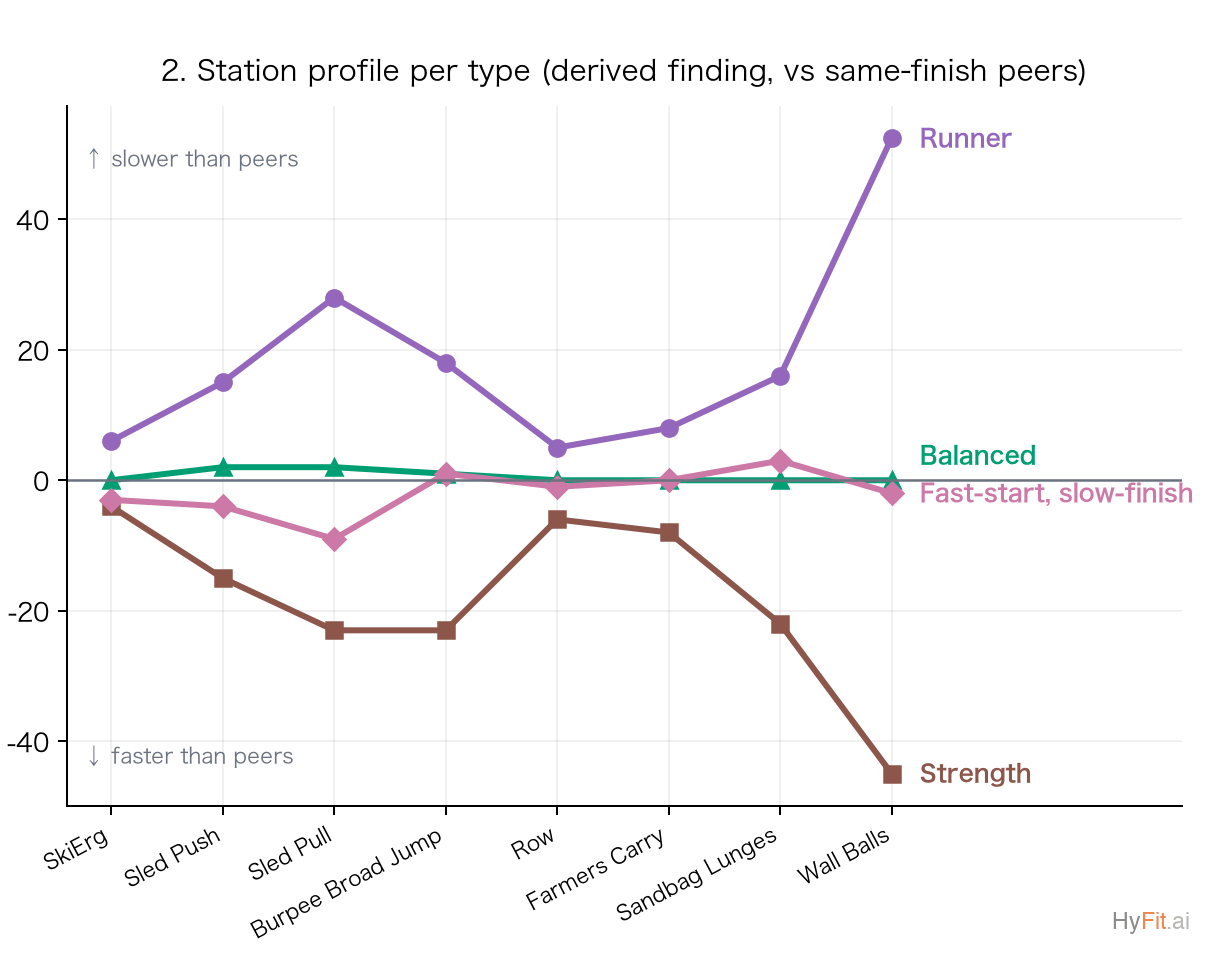
| Runner | 23.4% | Runs −189s, stations +155s — Wall Balls +52s the worst debt | 88.8 min | 4.2% |
| Strength | 20.0% | All eight stations −151s, crisp transitions; runs +169s | 89.2 min | 3.8% |
| Balanced | 29.7% | Both tilts within ±155s — no clear weakness | 82.0 min | 10.2% |
| Fast-start slow-finish | 26.9% | Fast start; runs and stations slow together late, Run 8 worst (median F +7.8%) | 102.8 min | 0.6% |
Your personal signature card Interactive
4.2What do the fastest look like?
Three facts worth remembering
- The top does not belong to the extremes. 61.3% of the top 5% are balanced (both tilts within ±155s), runner 19.8%, strength 15.5%; fast-start slow-finish just 3.5%. The faster the athlete, the less lopsided the profile.
- Balanced athletes reach the top 5% at 2.4–2.7× the rate of the tilted types (10.2% vs 4.2/3.8%) with the fastest median (82.0 min). No weakness is the strongest build.
- The other trait at the front is the negative split: 64.5% of the top 5% run faster late than early (F<−1%; 41% field-wide), rising monotonically with ability. The blunt fader name stays earned — 0.6% conversion.
How each type gets faster: answers from same-type athletes who made the top 5%
Comparing each type's top-5% members with the rest of their own type, all four share one direction — regression toward the middle: you advance by fixing the weakness, not stretching the strength:
- Runner: top-5% runners carry 68s less station debt (Wall Balls −28s) while holding a milder run edge (+37s) — train the big four, don't stack more mileage.
- Strength: top-5% strength athletes run 42s faster (−5.3 s/km) with a slightly smaller station edge — build the aerobic base and running economy.
- Balanced: top-5% balanced athletes are slightly better everywhere (stations −14s), no single magic dial — squeeze RoxZone and Wall Balls.
- Fast-start slow-finish: the few who advance fade 2.7pp less — the cheapest gain is pacing discipline itself: hold Run 1, and train "running while tired" as a capability.
Two common questions, answered directly
- "Attack Run 1?" The fastest athletes run fast Run 1s in absolute terms yet allocate them conservatively (Top-100: 2.3–3.9pp relatively slower, 2.8–4.3pp less fade). PB-day data splits it in two: Run 1 is 11.3s faster on PB day — "slightly faster" is right; but it improves least of the eight runs (Run 8: 18.8s), with gains concentrated in mid-to-late retention. Restricting to races 30/45 days apart doesn't change the direction.
- "How do PBs happen?" Not by secret tactics: of a mean 305s PB gap, Running is 132s (43%), Wall Balls 42s, BBJ 28s, Sled Pull 27s, RoxZone 23s; Ski+Row just 10s. On a good day nearly everything is faster — and the mid-to-late race, wall balls and loaded stations separate good days better than the first kilometre.
4.3Where gaps open — and how singles, doubles and relay differ
Station strategy: the data's "big four" and "small four"
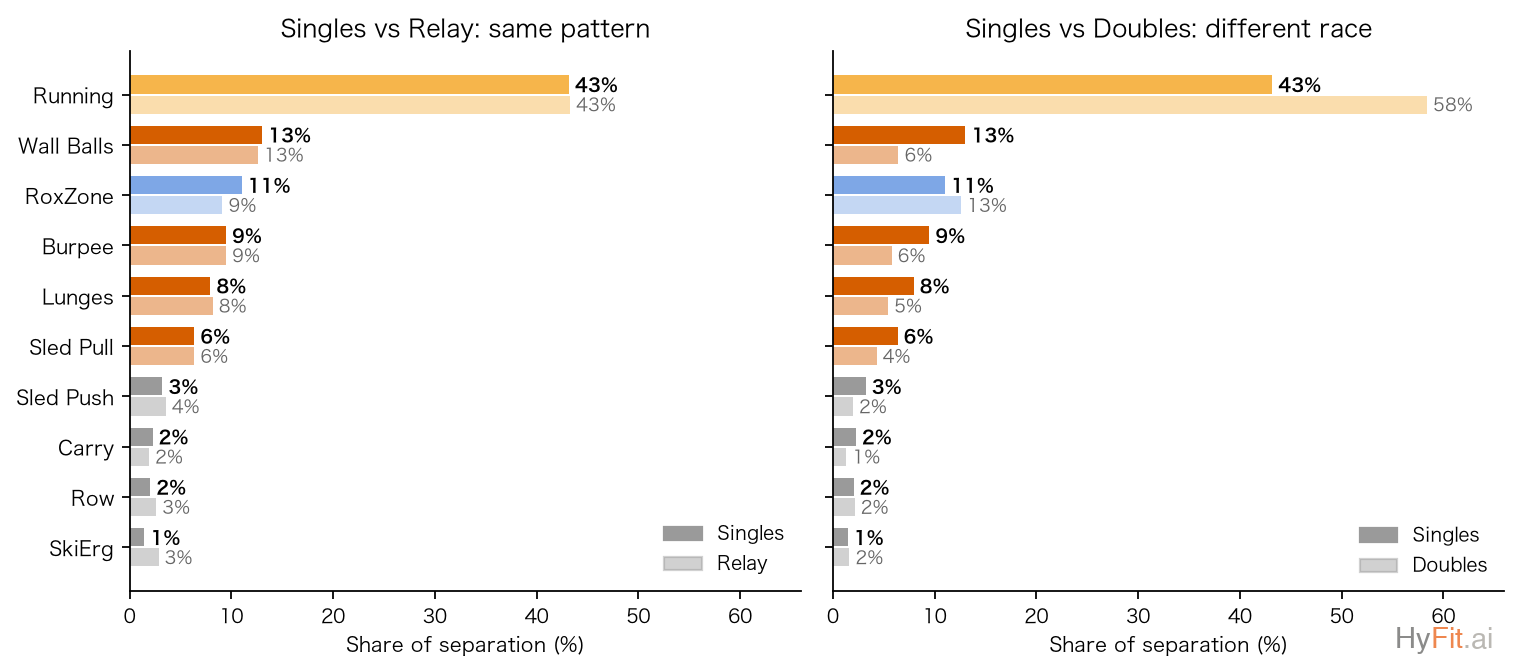
"Which station separates athletes" is a computable question: split the spread in finish times exactly into each component's contribution share (a variance decomposition). For Open singles the answer is tidy — running 43.9%, RoxZone 11.1%, then the big four: Wall Balls 12.9%, Burpee Broad Jump 9.7%, Sandbag Lunges 7.9%, Sled Pull 6.0% — 36.4% combined; the small four (Sled Push 3.0%, Farmers Carry 2.1%, Row 2.0%, SkiErg 1.5%) total just 8.6%. Four times the separating power — not hand-picked, computed, and stable across the fast, middle and slow thirds of the field.
Wall Balls: not the longest component, but highly discriminating
Wall Balls often contributes 10%–13% of a five-minute gap while consuming roughly 6%–8% of race time, so time-normalized leverage often exceeds 1.4. Within-athlete PB and podium comparisons agree. Brandt’s n=11 physiology study is only external context: Wall Balls showed peak HR/lactate/RPE.
RoxZone: real transition time
The pace calculator, five-minute decomposition, cross-season within-athlete pairs and PB decomposition all use the official RoxZone transition time. Open men 80→75 differ by ~32 seconds in RoxZone (11.0%, leverage 1.32). Top-10% repeat athletes are 23 seconds faster on PB days; within-athlete podium races are 25 seconds faster than non-podium races. RoxZone is real, visible time; whether to walk or jog it, result data can't answer — there is no per-transition or heart-rate data.
Ski / Row: small direct budget does not prove protective slowing
Ski and Row together usually explain only ~3%–5% of a five-minute gap, so they are not where the seconds are. But "give 5–10 seconds on the erg to protect the next run" doesn't check out in this data: athletes who pace ergs conservatively differ in ability to begin with, and our dedicated test failed. Proving it would take pre-race erg benchmarks and a randomized crossover trial.
Does the focus shift across levels?
Decomposing each five-minute step from 100→95 down to 60→55 (all cohorts agree in direction; use the tool above to inspect any step): Running is the top budget throughout; Wall Balls and RoxZone hold high shares at almost every stage; Sled Pull and Lunges grow near 60 minutes — loaded stations matter more as you get faster; Ski/Row stay last everywhere.
And in absolute time: the station-pace heatmap by finish band
Note: §3 and the text above decompose shares of a five-minute gap; this heatmap shows absolute time spent per component at each finish band (same data as the §2 calculator; cohort selectable).
How to read it: each row is one component, each column a target finish band (55–100 min); cells show the band's median time; each row's hue is its category (amber = running, blue = RoxZone, vermillion = core four, grey = other stations, consistent site-wide), and shading within the row tracks growth across bands. Read across a row for "how this component changes from 80 to 75 minutes"; read down a column for that band's full station budget (same data as the calculator). The Running row shows pace large, total time small.
| 组成项 | 55 | 60 | 65 | 70 | 75 | 80 | 85 | 90 | 95 | 100 |
|---|---|---|---|---|---|---|---|---|---|---|
| Running(8 跑合计) | 28:20 | 30:07 | 32:02 | 34:11 | 36:20 | 38:30 | 40:38 | 42:42 | 44:47 | 46:51 |
| RoxZone(官方计时) | 3:46 | 4:17 | 4:46 | 5:17 | 5:49 | 6:20 | 6:56 | 7:32 | 8:04 | 8:46 |
| SkiErg | 3:59 | 4:07 | 4:13 | 4:18 | 4:23 | 4:28 | 4:32 | 4:37 | 4:41 | 4:45 |
| Sled Push | 2:01 | 2:16 | 2:26 | 2:35 | 2:44 | 2:52 | 3:01 | 3:10 | 3:20 | 3:29 |
| Sled Pull | 2:53 | 3:15 | 3:35 | 3:53 | 4:11 | 4:30 | 4:49 | 5:08 | 5:26 | 5:46 |
| Burpee Broad Jump | 2:49 | 3:12 | 3:39 | 4:05 | 4:31 | 4:58 | 5:24 | 5:50 | 6:15 | 6:41 |
| Row | 4:05 | 4:15 | 4:23 | 4:30 | 4:36 | 4:43 | 4:50 | 4:56 | 5:02 | 5:09 |
| Farmers Carry | 1:27 | 1:33 | 1:39 | 1:46 | 1:54 | 2:00 | 2:07 | 2:14 | 2:21 | 2:27 |
| Sandbag Lunges | 2:51 | 3:16 | 3:41 | 4:04 | 4:27 | 4:48 | 5:10 | 5:32 | 5:53 | 6:13 |
| Wall Balls | 3:40 | 4:06 | 4:40 | 5:11 | 5:45 | 6:17 | 6:52 | 7:26 | 8:06 | 8:42 |
The “wall” is not one station—or just running
Late-run fade and late-station deterioration move together at population level and remain positively associated within athlete, but single-race directional accuracy is only 53.3%. Heavy-fade races show relatively faster Row but worse BBJ/Lunges/Wall Balls—consistent with resting on self-paced ergs and expressing fatigue later. One race can't diagnose "you hit the wall"; the signal only means something across races.
Singles, Doubles, Relay: different races, different levers
Run the same variance decomposition on all three formats: in Doubles, running's share of differentiation rises to 58.8% (PRO Doubles 55.0%) while the big four collapse — Wall Balls 12.9%→6.3%, BBJ 9.7%→5.9%, Lunges 7.9%→5.4%; Relay matches singles almost component-for-component (running 43.3%, WB 12.6%). The mechanisms separate cleanly: in doubles, station times vary less between athletes (Wall Balls narrows to 0.70 of the singles spread) and decouple from running fatigue — the fingerprint of work-sharing; relay stations don't narrow (they widen) yet also decouple — the fingerprint of freshness.
- RoxZone share differs by format: singles 11.1%, doubles 12.6%, relay 9.1%. Official timing has no separate changeover clock, so we report the numbers without attributing them.
- The last run can be sprinted: in course-matched pairs, doubles run Run 8 1.3–2.6pp less slowed vs their own early race — the other side of the sharing mechanism (the final wall balls are shared).
- Training implication: doubles prep shifts priority to running and shared pacing, discounting the big-four logic; relay prep follows singles logic — its edge is freshness and leg assignment.
Format note: doubles station logic is different
At the same 80-minute finish, Doubles spend 5–6 more minutes running (shared pace, slower-partner constrained) and buy it back at shareable stations: BBJ −1.4/−1.5, Wall Balls −1.1/−1.7, sleds ~−1 each, Lunges −0.8/−1.0 min; ergs barely help (Ski −0.3, Row −0.1) and RoxZone costs +0.5–0.8 min (no separate changeover clock in official timing, so we do not attribute it). Doubles priorities therefore tilt toward running and shared pacing; the singles "core four" logic carries less weight. Relay allocation is nearly identical to singles (every station |Δ|<0.5 min) — relay's edge is freshness, not sharing.
05 Converting Open, PRO, Doubles and four-person Relay
Conversions use same-athlete, same-team, same-event pairs. These athletes skew strong and race often, so treat the numbers as magnitudes.
| Conversion | n | Median change |
|---|---|---|
| Open → PRO (men) | 3,030 | +6.8 min |
| Open → PRO (women) | 553 | +4.9 min |
| Doubles vs own Singles | 41,700 | −9.3 min |
| Doubles vs pair mean (team) | 7,818 | −11.1 min |
| Relay vs four-member mean | 1,016 | −16.0 min |
| Triple-format: Doubles / Relay vs own Singles | 2,680 | −7.9 / −10.4 min |
Method: same athlete, two races within 45 days; times are converted to event-relative position then mapped back to minutes, killing venue effects. Widening the window to 45/90/180 days shifts results by ≤0.15 min, and strict same-event pairs agree. Relay uses teams where at least three of the four members could be identified (this adds virtually no bias — within 0.1 min of the 270 fully identified teams).
The Open→PRO cost is load-specific: Sled Push +1:20, Pull +1:33, Wall Balls +1:28, Lunges +0:52; Ski/Row/BBJ near zero. Doubles has no fixed benefit — the gain depends entirely on the partner gap; see the table below.
How the partner gap changes the outcome
| Partner gap (same-event singles) | Teams | Doubles − faster partner | Doubles − pair mean |
|---|---|---|---|
| ≤5 min | 353 | −8:40 | −9:59 |
| 5–10 min | 235 | −6:33 | −10:21 |
| 10–20 min | 250 | −4:26 | −11:17 |
| >20 min | 166 | +0:55 | −13:22 |
Close partners both gain from sharing; past a 20-minute gap the faster partner is bound by the shared run and the team underperforms their singles time. The windowed cohort (7,818 teams) reproduces the shape: the >20-min cell sits at −0.6s ≈ 0.
Conversion varies by ability
Reading straight off the quick-reference: at 60 minutes Doubles run ~19 s/km faster effective pace than Open men, but ~54 s/km faster at 90 minutes — the slower the band, the larger the benefit of sharing stations (stations weigh more in slower athletes' totals). The PRO-Doubles gap also widens down the field. Partner gap remains the single biggest variable (the +0:55 reversal above).
The same athlete across three formats: a conversion ladder
Among the 66 relay teams where all four members' identities could be matched: relay beats the four members' singles mean by 15:04 [confidence interval 14:02–16:40, likewise below] and the fastest member by 7:30. Cleaner still, the three-format sample: 1,382 athletes raced singles, doubles and relay within the season (967 all three at one event) — vs their own singles, doubles is 7.9 min faster [7.4–8.4] and relay 10.4 min [9.8–10.9]. These triple-format athletes are notably stronger and keener; treat these as magnitudes.
06 How to podium: does podium racing differ from ordinary PB racing?
Podium means top three in each Season-8 event × Open/PRO × sex × age-group cell with n≥10: 8,562 results across 2,854 cells. We compare within cell, then within 3,343 athletes who have both podium and non-podium races.
The key test: a different strategy, or just faster?
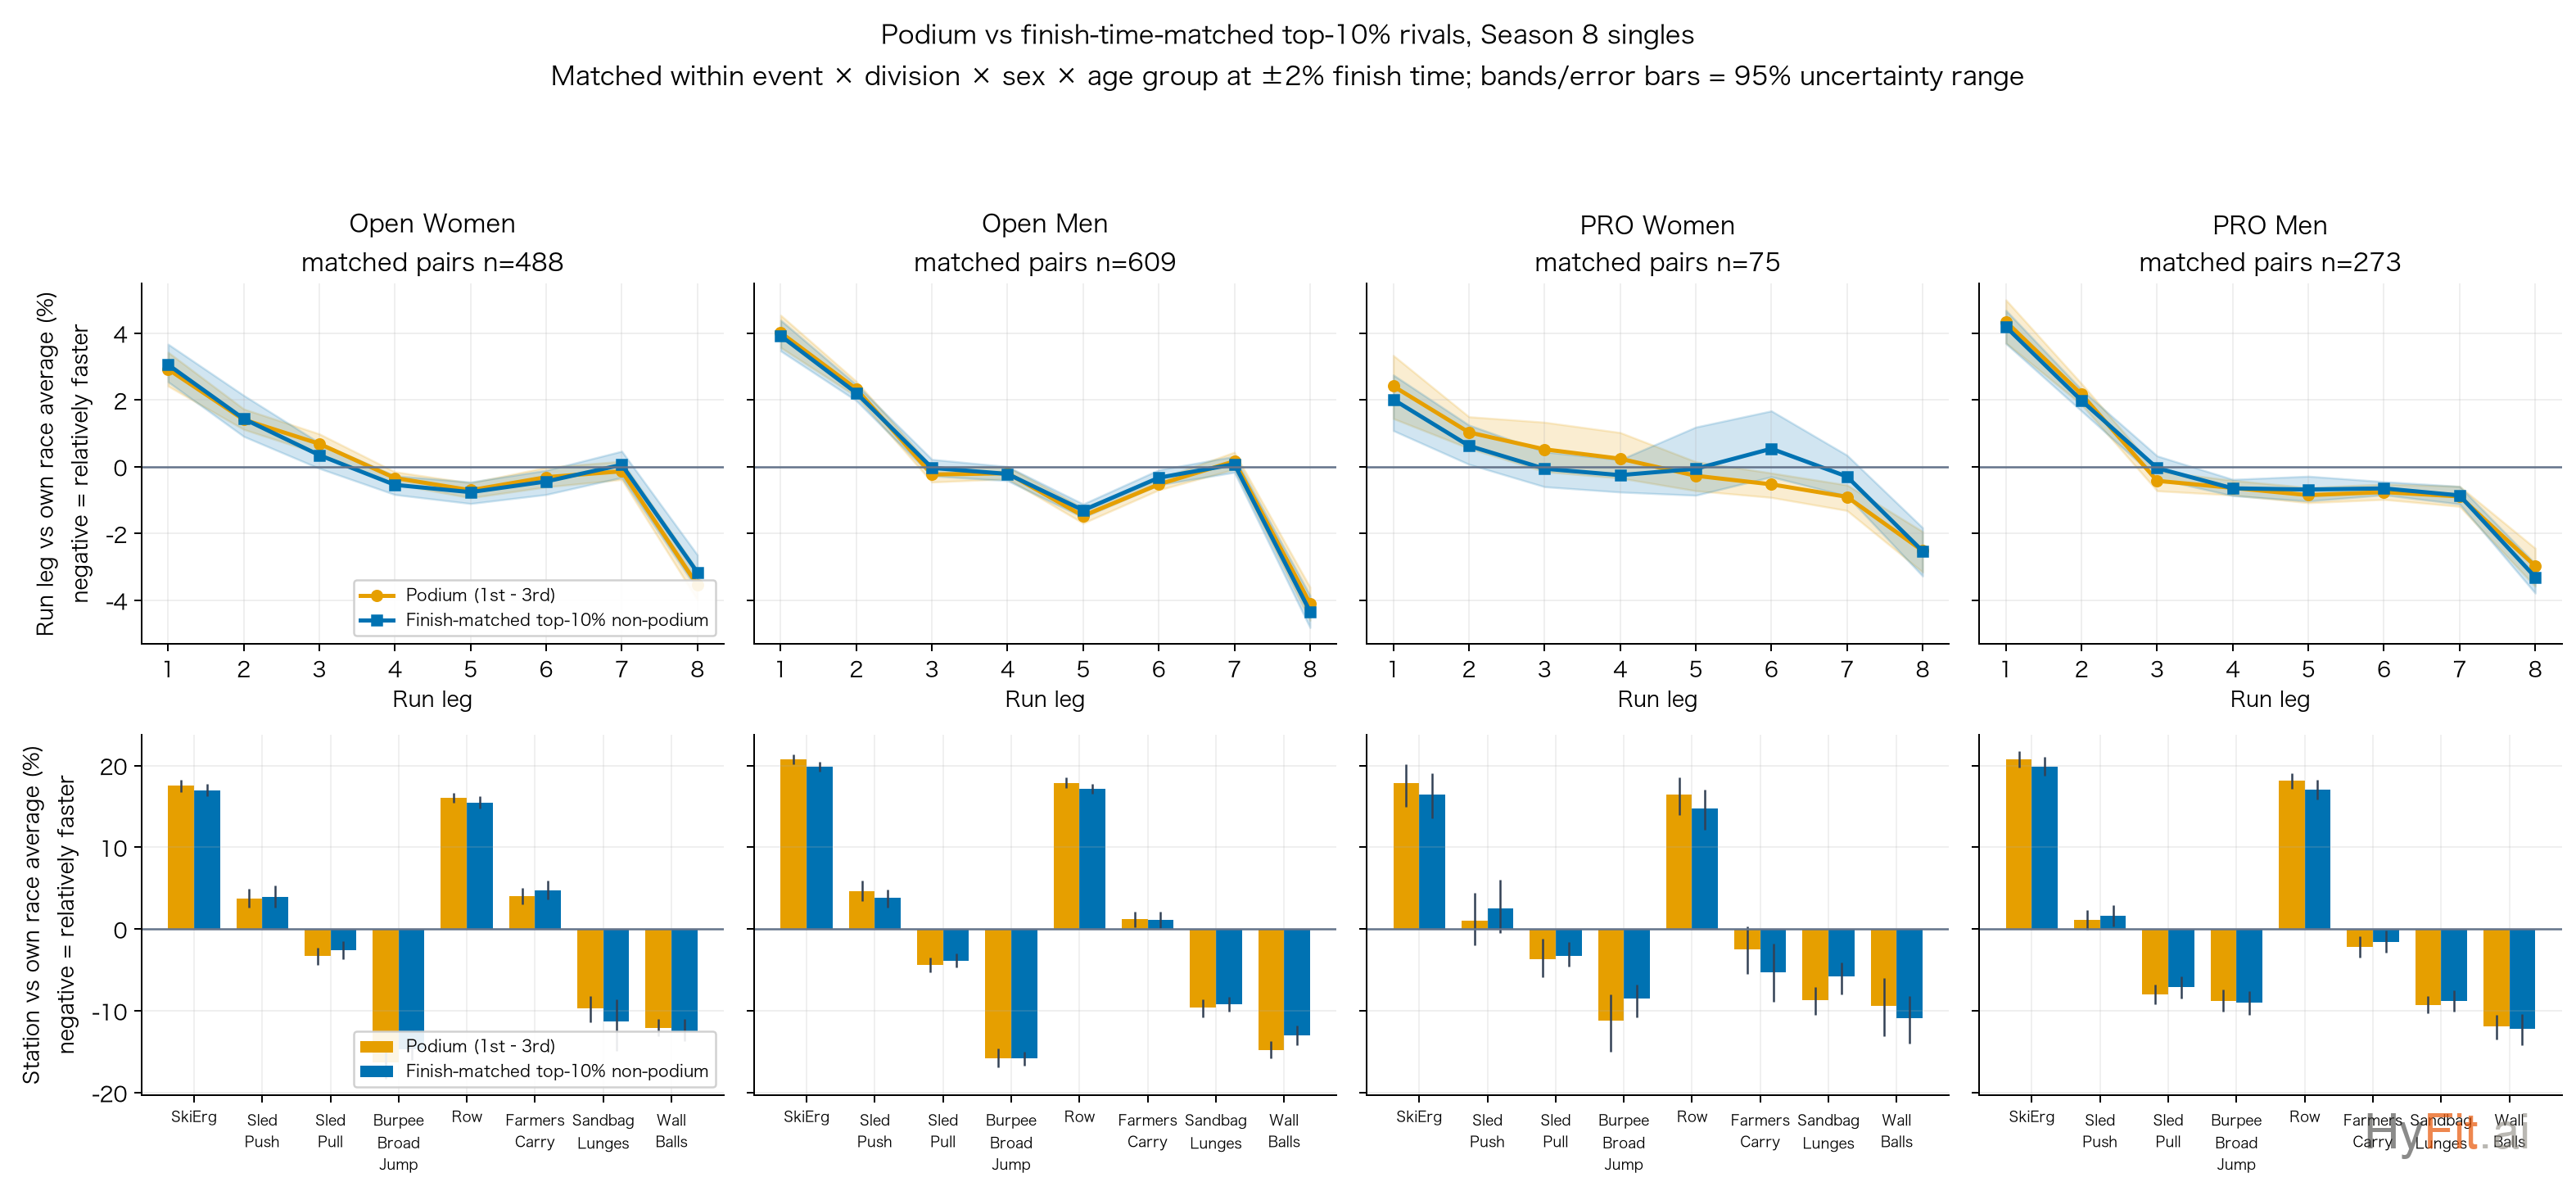
The table above has a trap: podium athletes are faster than their cells, so "strategy differences" may just shadow ability. The ability-matched version pairs each podium athlete with a top-10% non-podium athlete of nearly identical finish time (within 2%) in the same cell and compares shapes only (488/609/75/273 pairs; confidence intervals resampled event-by-event so athletes from the same race aren't treated as independent).
- Every shape difference collapses to null. Matched Run-1 diffs are −0.13 to +0.40pp and fade CIs all span zero (lone marginal exception: Pro women, −1.0pp, n=75). Podium racing is not a different pacing strategy — it is the same strategy executed on more ability.
- "Podiums require gambling on Run 1" is refuted. Podium finishers show less Run-1 variance (standard deviation: Open men 4.98 vs 5.72, non-overlapping confidence intervals) and only 39–42% sit on the fast-start side of the contrast median (50% baseline) — the podium population skews controlled, not risk-taking.
- What survives matching is small but real: transitions ~3–4 s faster per race (significant for Open/Pro men) and second-order station tilt (relatively easier ergs, 1.8–2.9% faster Wall Balls/Lunges in some strata) — podium athletes win on clean process, not aggressive tactics.
- Formats: Doubles reproduce the same pattern (null matched shapes; transitions −3.3 s); Relay's 16 splits are four different legs, so "pacing shape" would measure roster order, not pacing — explicitly skipped.
Practical translation: there is no podium-specific pacing chart. Execute the controlled start your ability supports, claw back 3–4 s in transitions, build a relative edge in Wall Balls/Lunges — and accept that podium outcomes are decided mostly by the ability gap to your cell's top three, then by clean execution. One blind spot: runaway winners cannot be matched, so this covers contested podiums, not dominant solo wins.
07 Finally: seven headline findings
- Eight years: from a handful of races to over a hundred per season. HYROX grew from 9 events in S1 (2019) to 111 in S8 (2026), with ~1.2M participations in a single season and 2M+ cumulatively; APAC's share rose from 3.7% to ~20%. Stickiness is rising too: over 40% race again within 12 months (41.7% full-S7; 43.6% early-S8 cohort1), and races per athlete per season climbed from 1.28 to 1.35.
- Your target finish maps directly to a pace. Open men finishing in 60 / 70 / 80 minutes hold an effective pace (8.7-km incl. RoxZone) of roughly 3:57 / 4:32 / 5:09 per km (Open women ~3–6s slower at the same band); PRO needs another 5–16 s/km, Doubles can run 20–45 s/km slower, and Relay is within 2–4 s/km of singles. Full bands in the §2 calculator.
- Five minutes faster: singles train running + the big four; doubles bet on running. For singles (60–80 min bands) running drives ~41% of the gap and the core four — Wall Balls, Burpee Broad Jump, Sled Pull, Sandbag Lunges — ~36% combined; Ski + Row total just 4.8%, the worst seconds-per-effort; RoxZone is 10–11% — run the transitions. Relay follows the same law (running 45%, core four 32%). Doubles are a different race: running 60%, RoxZone 11.7%, and no single station above 5.5% — train the shared run, not station splits.
- Four pace types; simply not fading beats a quarter of the field. Typed by two computable indices (balance B, fade F): runner 23%, strength 20%, balanced 30%, fast-start slow-finish 27%. Runner, strength and balanced athletes all reach podiums; the fader almost never does (0.6% conversion; median finish 14–21 min slower) — just not fading puts you ahead of ~27% of the field. One more trait at the front: 64.5% of the top 5% negative-split the race. Search your race in the results lookup to see your type.
- Format conversion rules of thumb (within-athlete, 45-day window). Open→PRO: ~6.8 min slower for men, ~4.9 for women (almost all at the loaded stations); a pair racing Doubles beats their singles average by ~11 min, but it hinges on the partner gap — ≤5 min apart the team still beats the faster partner by 8:40, past 20 min the edge vanishes; Relay beats the four-member average by ~16 min (n=1,016 teams).
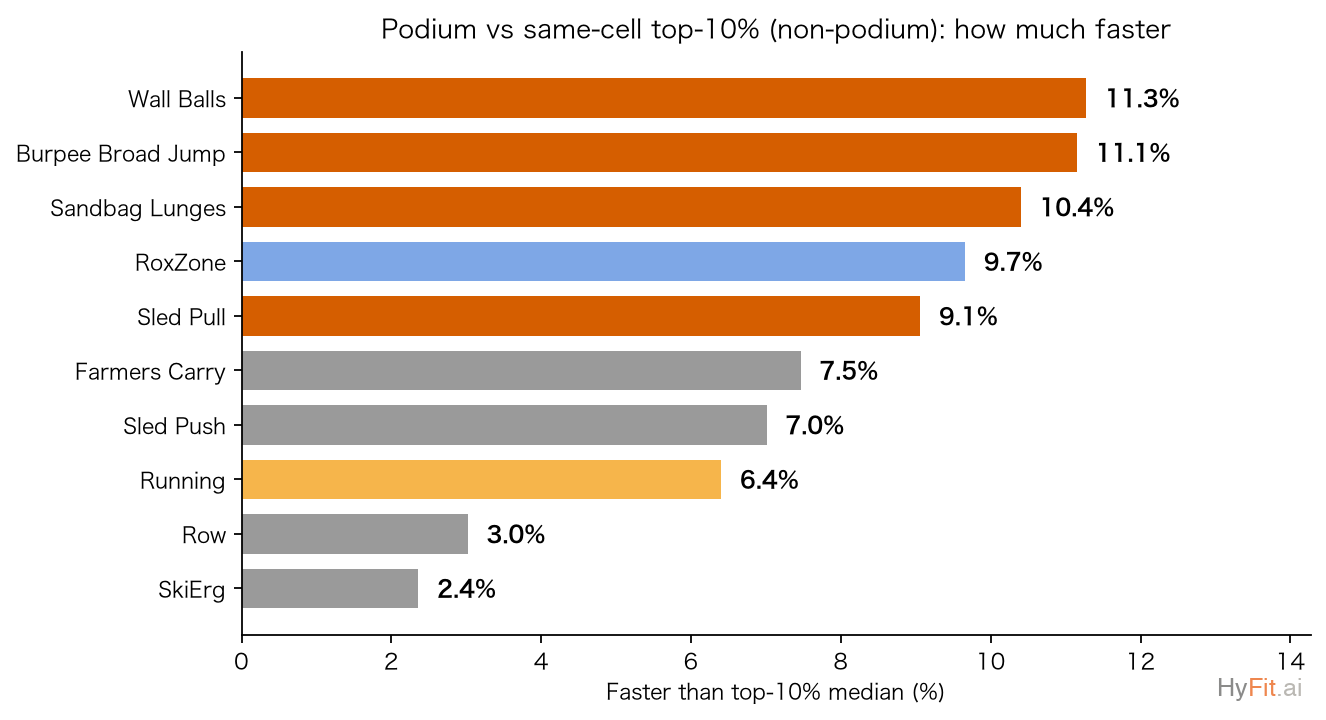
- Podium strategy is no different from elite strategy — podium finishers are simply faster at every station. Matched to equally-fast top-10% athletes, their pacing shapes coincide; their increment over the top 10% concentrates in the core four (~10–11% each) and RoxZone (9.7%), with running just 6.4%. There is no podium pacing chart: executing your level cleanly is the podium strategy.
- Judge yourself within your age group. About three quarters of the field is 25–44; the same 90-minute finish is top 61% at 25–29 but top 27% at 60–64. At matched ages PRO medians beat Open by 7–9 minutes — division choice is itself a selection.
注Footnotes
- At the data freeze, only the earliest 6,773 S8 entrants had completed the full 12-month window (later entrants hadn't had 12 months yet); a selective sample, not directly comparable with S7.
- Retention starts at each athlete's first Open/PRO Singles race of a season; identities are approximate name+nationality+sex links, with observation windows ending at the freeze. S1–S5 lack joint date and identity coverage.
附Appendices
Appendix 1 · Data source and cleaning
The primary data is a read-only snapshot of official results frozen on 2026-07-23 (1,305,177 rows; tamper-evident SHA-256 checksum archived). The 2026-07-24 cleaning removed 59,354 rows (4.55%) under mutually exclusive rules, retaining 1,245,823; on 2026-07-26 event dates were added without changing any results.
| Exclusive exclusion rule | Rows |
|---|---|
| Invalid/impossible total | 1,221 |
| S6 Doha confirmed wrong source | 36,414 |
| S7 Johannesburg mirror | 2,184 |
| Cross-scope clones/unresolved origins | 19,169 |
| Trajectory identity collisions + dupes | 366 |
An earlier cleaning pass accidentally removed legitimate Miami PRO records. Official spot checks exposed it; the current pass resolves the authoritative origin before deleting copies. The full rule set and row-by-row removal ledger are archived and available on request.
Appendix 2 · Core methods and evidence limits
Three study designs, and which sections use them
- Cross-sectional observation: comparing different groups at one point ("75-min vs 70-min finishers"). Answers what faster athletes look like — not whether copying them makes you faster.
- Within-athlete / within-team pairing: differencing two races of the same athlete removes stable ability differences; residual day-form and venue effects are curbed with 45-day windows and venue adjustment.
- Ability-matched contrast: pairing each target athlete (e.g. podium) with a near-identical-finish control to separate "faster" from "races differently".
| Section | Primary design |
|---|---|
| §1 field / retention / age | cross-sectional + longitudinal (retention, podium bar) |
| §2 calculator / §3 five minutes | cross-sectional (grouped by finish band); §3 adds within-athlete validation |
| §4 pace types / PB | cross-sectional clustering + within-athlete PB pairs (30/45-day windows) |
| §5 conversions | within-athlete/team pairing (45-day window, venue-adjusted) |
| §6 podium | cross-sectional + ability-matched + within-athlete podium pairs |
- 8.7 km: an empirical approximation, not the official course distance.
- Effective pace:
(eight runs + official RoxZone) / 8.7 km; run-only pace is separate. - Target bands: real performances within T±2.5 minutes, reporting P25/P50/P75 (fastest quartile, median, slowest quartile).
- Five-minute shares: mean differences between adjacent finish bands, not pacing benefit or training return.
- Pacing shape: each run is first adjusted for event, division and sex, then expressed relative to the athlete's own eight-run average — comparing shapes, not absolute ability.
- Podium: top three within event × division × sex × age group, n≥10, followed by within-athlete comparison.
Observational wording is “associated,” “consistent,” “suggests,” and “usually looks like”; “causes,” “protects,” and “should” require prospective or randomized intervention. The result data holds no training logs, perceived effort (RPE), heart rate, in-station breaks or no-rep calls, congestion, complete penalties, or pre-race ability — so single-race results cannot yield causal training prescriptions.
Appendix 3 · Related works
Prior work most relevant to this study:
- Brandt et al. (2025): n=11 simulated race; external context for intensity and Wall Balls load only.
- Fernández-Navarrete et al. (2026): 186,411 results with P10–P90 segment benchmarks across Singles, Doubles and Relay—the closest precedent for the target tables. Our contribution is the larger/current snapshot, band-by-band 55–100-minute distributions, official RoxZone timing, interactive lookup, within-athlete validation and explicit uncertainty. DOI
- Gutiérrez-Hellín et al. (2026): annual Top-50 PRO men across seven seasons (350 results, 138 athletes) show an evolving competitive frontier and pacing profile. It supports avoiding static elite cutoffs but does not replace full-field or paired analysis. DOI
- Dong & Li (2026): methodological precedent for trajectory clustering.
- Endurance durability literature: supports retained capacity under accumulated work as a construct.
- Dexheimer et al. (2019): different mixed workouts are predicted by different capacities.
- Rappelt et al. (2026): a source and sample-coverage comparator only (PRO/ELITE, S1–S7, 39,696 results).
Only citations directly relevant to these findings are listed; a fuller literature review will accompany the paper version.